What does property cost in Tâmega e Sousa?
The figures below are the latest official medians for the region, each shown beside its reference period and INE source. Transacted (sold) prices are drawn from INE’s house-price statistics; the national median is shown alongside so you can see how the region compares.
€1,234/m²
Tâmega e Sousa
€2,168/m²
Portugal
€5.36/m²
Tâmega e Sousa
Sub-region level (Tâmega e Sousa) — INE publishes the rent series by NUTS-III only, so there is no separate concelho-level rent figure for these municipalities.
How Tâmega e Sousa sold prices have moved
Median sold price · Tâmega e Sousa, last 12 months (line, left axis) against dwellings sold in the last 12 months (bars, right axis).
Q4 2019 → Q1 2026Latest data: Q1 2026
Median sold price · Tâmega e Sousa: Instituto Nacional de Estatística (INE), Portugal · indicator 0012234 (dim3=H1) · retrieved 2026-08-12 · CC BY 4.0
Sold in last 12 months: Instituto Nacional de Estatística (INE), Portugal · indicator 0014363 · retrieved 2026-10-02 · CC BY 4.0
Show the data as a table (26 quarters)
| Quarter | Median sold price · Tâmega e Sousa (last 12 months, €/m²) | Sold in last 12 months (dwellings) |
|---|---|---|
| Q1 2026 | 1,234 | 4,181 |
| Q4 2025 | 1,185 | 4,201 |
| Q3 2025 | 1,115 | 4,073 |
| Q2 2025 | 1,069 | 3,945 |
| Q1 2025 | 1,010 | 3,882 |
| Q4 2024 | 983 | 3,820 |
| Q3 2024 | 952 | 3,616 |
| Q2 2024 | 933 | 3,575 |
| Q1 2024 | 939 | 3,381 |
| Q4 2023 | 913 | 3,312 |
| Q3 2023 | 902 | 3,302 |
| Q2 2023 | 887 | 3,382 |
| Q1 2023 | 863 | 3,426 |
| Q4 2022 | 859 | 3,514 |
| Q3 2022 | 852 | 3,733 |
| Q2 2022 | 825 | 3,664 |
| Q1 2022 | 795 | 3,725 |
| Q4 2021 | 780 | 3,611 |
| Q3 2021 | 754 | 3,363 |
| Q2 2021 | 750 | 3,285 |
| Q1 2021 | 753 | 2,936 |
| Q4 2020 | 749 | 2,852 |
| Q3 2020 | 724 | 2,886 |
| Q2 2020 | 705 | 2,887 |
| Q1 2020 | 692 | 3,059 |
| Q4 2019 | 675 | 3,072 |
Asking vs sold
Asking-price data pending — we publish an asking figure only from a licensed source, never scraped listings, and we always label it separately from the sold (INE) median so the two are never conflated.
What does each type of property cost in Tâmega e Sousa?
Two official medians, kept deliberately apart. Bank appraisals are what lenders valued homes at; registered sales are what buyers actually paid. They are measured differently, published on different cadences, and are never averaged together.
Flats vs villas
Bank appraisal · INE · €/m²Median value of bank evaluations on housing — what lenders valued property at for mortgage purposes. It is a valuation opinion, not a transacted price, so it is never mixed with the sale medians below.
| Construction type | Median | Period |
|---|---|---|
| Flats | Median€1,640€/m² | PeriodAugust 2026 |
| Villas | Median€1,351€/m² | PeriodAugust 2026 |
| All housing | Median€1,486€/m² | PeriodAugust 2026 |
Instituto Nacional de Estatística (INE), Portugal — CC BY 4.0. Each row carries its own reference period, shown above.
New vs existing homes
Sold · INE · €/m²Median value of registered dwelling sales — what buyers actually transacted at, split by whether the home was newly built or already existing. This is the sold family; it is never mixed with appraisals.
| Dwelling condition | Median | Period |
|---|---|---|
| New dwellings | Median€1,452€/m² | Period1st Quarter 2026 |
| Existing dwellings | Median€1,136€/m² | Period1st Quarter 2026 |
| All dwellings | Median€1,234€/m² | Period1st Quarter 2026 |
Instituto Nacional de Estatística (INE), Portugal — CC BY 4.0. Each row carries its own reference period, shown above.
Prices are one part of the picture. Below, see how Tâmega e Sousa sits through the market cycle — bank appraisals against sold prices, transaction activity and rents, each drawn live from INE with its source and reference period.
Tâmega e Sousa — market data
Every chart below is drawn server-side as SVG with a full data table beside it and its INE source, reference period and licence — so the numbers are readable and citable straight from the page, with no images and nothing to click through. Values are the latest the warehouse can source; a suppressed period is shown as a gap, never a zero.
Price trend — sold vs bank appraisal
Median sold price: Instituto Nacional de Estatística (INE), Portugal · retrieved 2026-08-12T23:51:31.305187Z · CC BY 4.0
Bank appraisal: Instituto Nacional de Estatística (INE), Portugal · retrieved 2026-10-02T21:14:26.321288Z · CC BY 4.0
Portugal (national): Instituto Nacional de Estatística (INE), Portugal · retrieved 2026-08-12T23:51:31.305187Z · CC BY 4.0
Quarterly
| Period | Median sold price (€/m²) | |
|---|---|---|
| 2nd Quarter 2023 | 887 | |
| 3rd Quarter 2023 | 902 | |
| 4th Quarter 2023 | 913 | |
| 1st Quarter 2024 | 939 | |
| 2nd Quarter 2024 | 933 | |
| 3rd Quarter 2024 | 952 | |
| 4th Quarter 2024 | 983 | |
| 1st Quarter 2025 | 1010 | |
| 2nd Quarter 2025 | 1069 | |
| 3rd Quarter 2025 | 1115 | |
| 4th Quarter 2025 | 1185 | |
| 1st Quarter 2026 | 1234 | |
| Median sold price | Latest 1st Quarter 2026: 1,234 · Min 675 · Max 1,234 · Range 559 · CAGR +10.1%/yr | |
| Portugal (national) | Latest 1st Quarter 2026: 2,168 · Min 1,094 · Max 2,168 · Range 1,074 · CAGR +11.6%/yr | |
Show all 26 rows
| Period | Median sold price (€/m²) | |
|---|---|---|
| 4th Quarter 2019 | 675 | |
| 1st Quarter 2020 | 692 | |
| 2nd Quarter 2020 | 705 | |
| 3rd Quarter 2020 | 724 | |
| 4th Quarter 2020 | 749 | |
| 1st Quarter 2021 | 753 | |
| 2nd Quarter 2021 | 750 | |
| 3rd Quarter 2021 | 754 | |
| 4th Quarter 2021 | 780 | |
| 1st Quarter 2022 | 795 | |
| 2nd Quarter 2022 | 825 | |
| 3rd Quarter 2022 | 852 | |
| 4th Quarter 2022 | 859 | |
| 1st Quarter 2023 | 863 | |
| 2nd Quarter 2023 | 887 | |
| 3rd Quarter 2023 | 902 | |
| 4th Quarter 2023 | 913 | |
| 1st Quarter 2024 | 939 | |
| 2nd Quarter 2024 | 933 | |
| 3rd Quarter 2024 | 952 | |
| 4th Quarter 2024 | 983 | |
| 1st Quarter 2025 | 1010 | |
| 2nd Quarter 2025 | 1069 | |
| 3rd Quarter 2025 | 1115 | |
| 4th Quarter 2025 | 1185 | |
| 1st Quarter 2026 | 1234 | |
| Median sold price | Latest 1st Quarter 2026: 1,234 · Min 675 · Max 1,234 · Range 559 · CAGR +10.1%/yr | |
| Portugal (national) | Latest 1st Quarter 2026: 2,168 · Min 1,094 · Max 2,168 · Range 1,074 · CAGR +11.6%/yr | |
Monthly
| Period | Bank appraisal (€/m²) |
|---|---|
| September 2025 | 1280 |
| October 2025 | 1315 |
| November 2025 | 1352 |
| December 2025 | 1374 |
| January 2026 | 1373 |
| February 2026 | 1372 |
| March 2026 | 1400 |
| April 2026 | 1420 |
| May 2026 | 1441 |
| June 2026 | 1444 |
| July 2026 | 1478 |
| August 2026 | 1486 |
| Bank appraisal | Latest August 2026: 1,486 · Min 544 · Max 1,486 · Range 942 · CAGR +5.6%/yr |
Show all 188 rows
| Period | Bank appraisal (€/m²) |
|---|---|
| January 2011 | 635 |
| February 2011 | 635 |
| March 2011 | 633 |
| April 2011 | 634 |
| May 2011 | 637 |
| June 2011 | 634 |
| July 2011 | 622 |
| August 2011 | 623 |
| September 2011 | 606 |
| October 2011 | 607 |
| November 2011 | 603 |
| December 2011 | 602 |
| January 2012 | 570 |
| February 2012 | 578 |
| March 2012 | 585 |
| April 2012 | 600 |
| May 2012 | 590 |
| June 2012 | 595 |
| July 2012 | 574 |
| August 2012 | 575 |
| September 2012 | 568 |
| October 2012 | 568 |
| November 2012 | 563 |
| December 2012 | 575 |
| January 2013 | 568 |
| February 2013 | 558 |
| March 2013 | 550 |
| April 2013 | 554 |
| May 2013 | 556 |
| June 2013 | 563 |
| July 2013 | 562 |
| August 2013 | 558 |
| September 2013 | 548 |
| October 2013 | 552 |
| November 2013 | 551 |
| December 2013 | 563 |
| January 2014 | 562 |
| February 2014 | 569 |
| March 2014 | 560 |
| April 2014 | 567 |
| May 2014 | 565 |
| June 2014 | 570 |
| July 2014 | 575 |
| August 2014 | 589 |
| September 2014 | 581 |
| October 2014 | 573 |
| November 2014 | 553 |
| December 2014 | 558 |
| January 2015 | 554 |
| February 2015 | 556 |
| March 2015 | 551 |
| April 2015 | 544 |
| May 2015 | 559 |
| June 2015 | 559 |
| July 2015 | 562 |
| August 2015 | 561 |
| September 2015 | 566 |
| October 2015 | 573 |
| November 2015 | 569 |
| December 2015 | 579 |
| January 2016 | 579 |
| February 2016 | 586 |
| March 2016 | 579 |
| April 2016 | 578 |
| May 2016 | 585 |
| June 2016 | 596 |
| July 2016 | 591 |
| August 2016 | 598 |
| September 2016 | 589 |
| October 2016 | 590 |
| November 2016 | 593 |
| December 2016 | 596 |
| January 2017 | 604 |
| February 2017 | 611 |
| March 2017 | 619 |
| April 2017 | 621 |
| May 2017 | 629 |
| June 2017 | 625 |
| July 2017 | 626 |
| August 2017 | 627 |
| September 2017 | 637 |
| October 2017 | 643 |
| November 2017 | 645 |
| December 2017 | 655 |
| January 2018 | 663 |
| February 2018 | 660 |
| March 2018 | 651 |
| April 2018 | 653 |
| May 2018 | 655 |
| June 2018 | 674 |
| July 2018 | 677 |
| August 2018 | 683 |
| September 2018 | 689 |
| October 2018 | 692 |
| November 2018 | 698 |
| December 2018 | 696 |
| January 2019 | 693 |
| February 2019 | 685 |
| March 2019 | 689 |
| April 2019 | 689 |
| May 2019 | 694 |
| June 2019 | 696 |
| July 2019 | 710 |
| August 2019 | 720 |
| September 2019 | 729 |
| October 2019 | 721 |
| November 2019 | 720 |
| December 2019 | 720 |
| January 2020 | 736 |
| February 2020 | 747 |
| March 2020 | 753 |
| April 2020 | 751 |
| May 2020 | 755 |
| June 2020 | 768 |
| July 2020 | 784 |
| August 2020 | 793 |
| September 2020 | 781 |
| October 2020 | 761 |
| November 2020 | 753 |
| December 2020 | 758 |
| January 2021 | 782 |
| February 2021 | 797 |
| March 2021 | 800 |
| April 2021 | 803 |
| May 2021 | 800 |
| June 2021 | 793 |
| July 2021 | 801 |
| August 2021 | 798 |
| September 2021 | 829 |
| October 2021 | 829 |
| November 2021 | 838 |
| December 2021 | 826 |
| January 2022 | 841 |
| February 2022 | 857 |
| March 2022 | 882 |
| April 2022 | 893 |
| May 2022 | 904 |
| June 2022 | 917 |
| July 2022 | 923 |
| August 2022 | 926 |
| September 2022 | 921 |
| October 2022 | 914 |
| November 2022 | 917 |
| December 2022 | 918 |
| January 2023 | 940 |
| February 2023 | 966 |
| March 2023 | 982 |
| April 2023 | 985 |
| May 2023 | 974 |
| June 2023 | 999 |
| July 2023 | 996 |
| August 2023 | 1003 |
| September 2023 | 999 |
| October 2023 | 1004 |
| November 2023 | 1011 |
| December 2023 | 1016 |
| January 2024 | 1041 |
| February 2024 | 1053 |
| March 2024 | 1054 |
| April 2024 | 1045 |
| May 2024 | 1054 |
| June 2024 | 1090 |
| July 2024 | 1101 |
| August 2024 | 1100 |
| September 2024 | 1103 |
| October 2024 | 1124 |
| November 2024 | 1128 |
| December 2024 | 1130 |
| January 2025 | 1129 |
| February 2025 | 1149 |
| March 2025 | 1170 |
| April 2025 | 1200 |
| May 2025 | 1222 |
| June 2025 | 1223 |
| July 2025 | 1222 |
| August 2025 | 1238 |
| September 2025 | 1280 |
| October 2025 | 1315 |
| November 2025 | 1352 |
| December 2025 | 1374 |
| January 2026 | 1373 |
| February 2026 | 1372 |
| March 2026 | 1400 |
| April 2026 | 1420 |
| May 2026 | 1441 |
| June 2026 | 1444 |
| July 2026 | 1478 |
| August 2026 | 1486 |
| Bank appraisal | Latest August 2026: 1,486 · Min 544 · Max 1,486 · Range 942 · CAGR +5.6%/yr |
| Period | Sold (€/m²) | YoY % |
|---|---|---|
| 1st Quarter 2026 | 1,234 | +22.2% |
| 4th Quarter 2025 | 1,185 | +20.5% |
| 3rd Quarter 2025 | 1,115 | +17.1% |
| 2nd Quarter 2025 | 1,069 | +14.6% |
| 1st Quarter 2025 | 1,010 | +7.6% |
| 4th Quarter 2024 | 983 | +7.7% |
| 3rd Quarter 2024 | 952 | +5.5% |
| 2nd Quarter 2024 | 933 | +5.2% |
Show earlier periods (18)
| 1st Quarter 2024 | 939 | +8.8% |
|---|---|---|
| 4th Quarter 2023 | 913 | +6.3% |
| 3rd Quarter 2023 | 902 | +5.9% |
| 2nd Quarter 2023 | 887 | +7.5% |
| 1st Quarter 2023 | 863 | +8.6% |
| 4th Quarter 2022 | 859 | +10.1% |
| 3rd Quarter 2022 | 852 | +13% |
| 2nd Quarter 2022 | 825 | +10% |
| 1st Quarter 2022 | 795 | +5.6% |
| 4th Quarter 2021 | 780 | +4.1% |
| 3rd Quarter 2021 | 754 | +4.1% |
| 2nd Quarter 2021 | 750 | +6.4% |
| 1st Quarter 2021 | 753 | +8.8% |
| 4th Quarter 2020 | 749 | +11% |
| 3rd Quarter 2020 | 724 | — |
| 2nd Quarter 2020 | 705 | — |
| 1st Quarter 2020 | 692 | — |
| 4th Quarter 2019 | 675 | — |
More Tâmega e Sousa data in the Data Explorer
These series live in the full Data Explorer, where you can compare, filter and export them alongside every other Tâmega e Sousa indicator.
Where exactly in Tâmega e Sousa?
Those trends describe Tâmega e Sousa as a whole. Below, place it on the map to see exactly where they apply — and, where the data allows, how prices vary from one part of the region to the next.
Tâmega e Sousa on the map
The 11 municipalities that make up Tâmega e Sousa. Select a municipality to open its concelho guide.
- 1. Castelo de Paiva
- 2. Celorico de Basto
- 3. Amarante
- 4. Baião
- 5. Felgueiras
- 6. Lousada
- 7. Marco de Canaveses
- 8. Paços de Ferreira
- 9. Penafiel
- 10. Cinfães
- 11. Resende
Boundaries: Direção-Geral do Território — Carta Administrativa Oficial de Portugal (CAOP2025) — source — CC BY 4.0 (DGT)
What is living in Tâmega e Sousa like?
Knowing where a property sits is only half the decision — the other half is what daily life there is like. Here are the liveability signals we can source for Tâmega e Sousa today, each added as the data becomes available.
3.8doctors/1k inhab.
Medical doctors per 1,000 inhabitants · S7A2025
0.2pharmacies/1k inhab.
Pharmacies per 1,000 inhabitants · S7A2025
25,043accesses
Fixed broadband Internet accesses · S7A2025
21.6
crimes/1k residents
Registered crimes per 1,000 residents · 2025 crime counts over 2021 resident population
Derived: registered_crimes / population_2021 * 1000
0beaches
Blue Flag beaches (regional total) · S7A2026
Regional total (NUTS3) — shared across the surrounding region, not this municipality alone. NUTS regional total broadcast to member concelhos — the WHOLE region's count, NOT this concelho's own; never sum across concelhos.
8°C–29°C
Observed range · August 2025 – October 2026
Coolest: mean daily low, November 2025 · Warmest: mean daily high, September 2026
Not a full-year normal — our IPMA observations cover August 2025 – October 2026, so the coldest winter months are not represented.
IPMA — Instituto Português do Mar e da AtmosferaFree reuse with attribution to IPMA (open-data)
Tâmega e Sousa at a glance
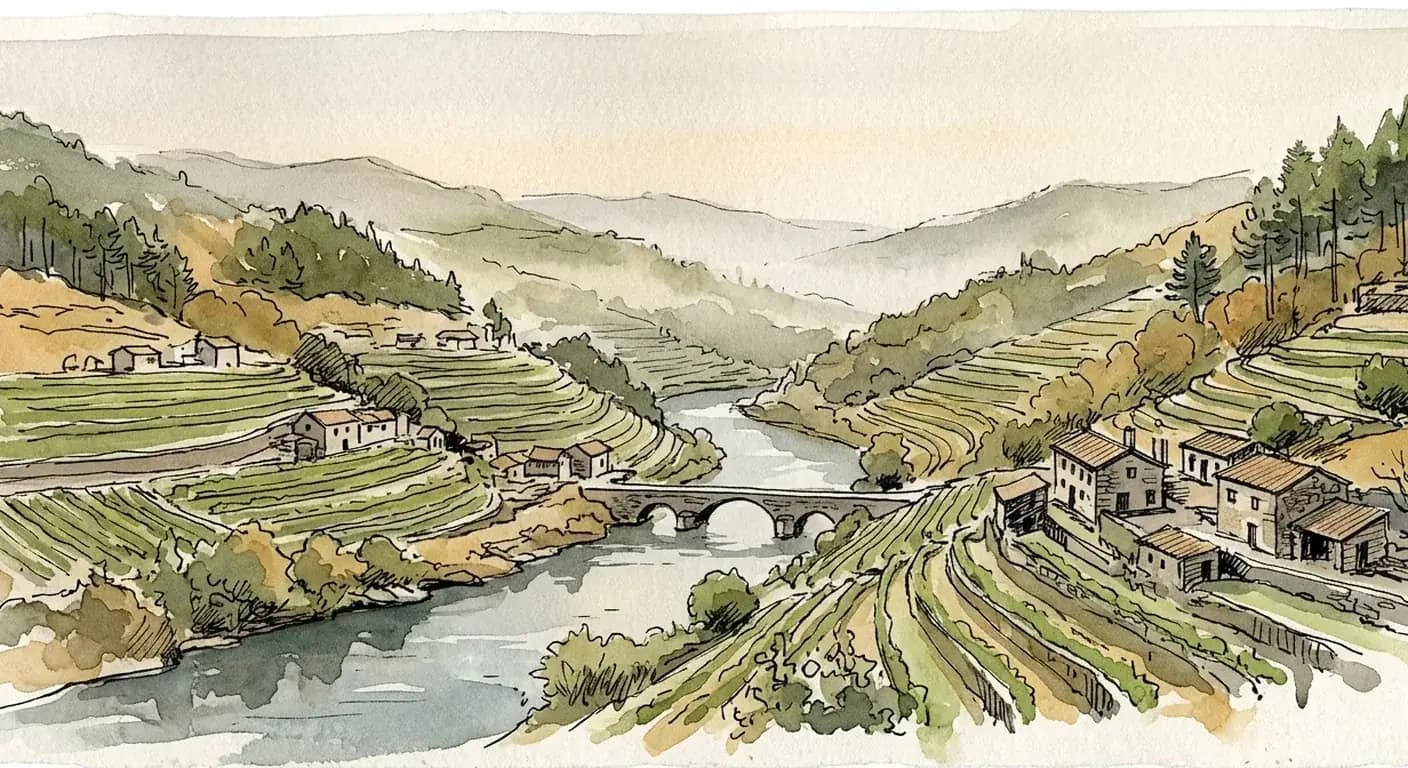
Tâmega e Sousa is the NUTS-III sub-region immediately inland from the Porto metropolitan area, following the Tâmega and Sousa river valleys south and east of the city. Its main municipalities — Penafiel, Amarante, Felgueiras, Lousada, Paços de Ferreira, Marco de Canaveses and Baião — mix a long-established manufacturing base (furniture around Paços de Ferreira, footwear and textiles around Felgueiras) with vineyards, farmland and Romanesque heritage.
For buyers it reads as the affordable commuter and lifestyle hinterland of Porto: the motorway network and the Douro rail line put much of it within a manageable drive of the city, while transacted prices sit well below the metropolitan area. The figures above are the official medians published for the sub-region itself, with full provenance — not an average synthesised from its municipalities. Each municipality also has its own page with its own concelho-level figures.
What are the rules and costs in Tâmega e Sousa?
Lifestyle is the human side of the decision; the rules and costs are the practical one. These are the two rules that shape most purchases in Tâmega e Sousa — plus the guides and calculator to model your all-in costs.
Two rules shape most purchases here — whether a property can be let short-term, and what it costs to hold each year — followed by the guides and calculator to model your full purchase.
Can you run a short-term rental here?
Short-term letting (Alojamento Local, AL) is a modest part of the picture here compared with Porto or the coast, but it exists around Amarante, the Douro-facing parts of Baião and Marco de Canaveses, and the Romanesque route. AL is regulated at the municipal level under the national regime (Decreto-Lei 128/2014, as amended); registration requirements, and any contention-style restrictions on new registrations, are set concelho by concelho and change over time.
This is general information, not legal advice — confirm the current AL status and any local limits for a specific address with the relevant câmara municipal before assuming a property can be operated as a short-term rental.
What about annual property tax (IMI)?
Municipal Property Tax (IMI) is levied annually by each concelho within a band set nationally, so the exact rate depends on the municipality and the property’s taxable value (VPT) — rates across the Tâmega e Sousa municipalities are set independently and can differ from one another and from Porto. Any specific rate we publish is sourced from the official register with its reference year; where the warehouse cannot yet source a rate it is shown as pending rather than estimated.
Common questions about Tâmega e Sousa
- How much does property cost per square metre in Tâmega e Sousa?
- In Tâmega e Sousa, the median transacted (sold) price is about €1,234 per square metre (1st Quarter 2026). For comparison, the national median sold price is about €2,168 per square metre (1st Quarter 2026). Source: Instituto Nacional de Estatística (INE), Portugal, CC BY 4.0.
- How much do flats and villas cost per square metre in Tâmega e Sousa?
- In Tâmega e Sousa, the median bank appraisal value is about €1,640 per square metre for flats and €1,351 per square metre for villas (August 2026). These are lender valuations for mortgage purposes, not transacted prices. Registered sales — what buyers actually paid — ran about €1,452 per square metre for newly built homes and €1,136 per square metre for existing homes (1st Quarter 2026). Source: Instituto Nacional de Estatística (INE), Portugal, CC BY 4.0.
- What is the average rent per square metre in Tâmega e Sousa?
- In Tâmega e Sousa, the median new-lease rent — what tenants pay to let, a separate measure from any sale or asking price — is about €5.36 per square metre (2nd Quarter 2026). Source: Instituto Nacional de Estatística (INE), Portugal, CC BY 4.0.
- What is the climate like in Tâmega e Sousa?
- Over the August 2025 – October 2026 climate observations available for Tâmega e Sousa's anchor municipality, the mean daily low reached about 8.4°C (in November 2025) and the mean daily high about 28.9°C (in September 2026). This is the observed range for that window, not a full-year normal: our IPMA observations do not span a full calendar year, so the coldest winter months are not represented. Source: IPMA — Instituto Português do Mar e da Atmosfera, Free reuse with attribution to IPMA (open-data).
- What is the reported-crime rate in Tâmega e Sousa?
- Tâmega e Sousa's anchor municipality records about 21.6 crimes/1k residents (Registered crimes per 1,000 residents, reference period 2025 crime counts over 2021 resident population). Derived as registered_crimes / population_2021 * 1000. Source: Instituto Nacional de Estatística (INE), Portugal, CC BY 4.0.
- What healthcare access does Tâmega e Sousa have?
- Tâmega e Sousa's anchor municipality reports medical doctors per 1,000 inhabitants: 3.8 doctors/1k inhab., reference period S7A2025; pharmacies per 1,000 inhabitants: 0.2 pharmacies/1k inhab., reference period S7A2025; hospitals: 2 hospitals, reference period S7A2024. Source: Instituto Nacional de Estatística (INE), Portugal.
- What is internet connectivity like in Tâmega e Sousa?
- Tâmega e Sousa's anchor municipality reports fixed broadband internet accesses: 25,043 accesses, reference period S7A2025. Source: Instituto Nacional de Estatística (INE), Portugal.
- How many Blue Flag beaches does Tâmega e Sousa have?
- Tâmega e Sousa's anchor municipality reports blue flag beaches (regional total): 0 beaches (regional total, shared across the surrounding region), reference period S7A2026. Source: Instituto Nacional de Estatística (INE), Portugal.
Plan your purchase
Go deeper
Recent legal changes
Compare regions
Municipalities in Tâmega e Sousa
Every municipality below has its own page, held to the same provenance discipline: a figure appears only when the warehouse can source it, shown with its INE source and reference period. Where it cannot, the page says so in place of the figure. Never an estimate.
We publish a number only when the warehouse can source it. Many of the series shown here, including the sold-price median, are listed in the public data registry with their official sources, reference periods and licences. The dwellings-sold bars in the price chart print their source, INE indicator code and licence under the chart.