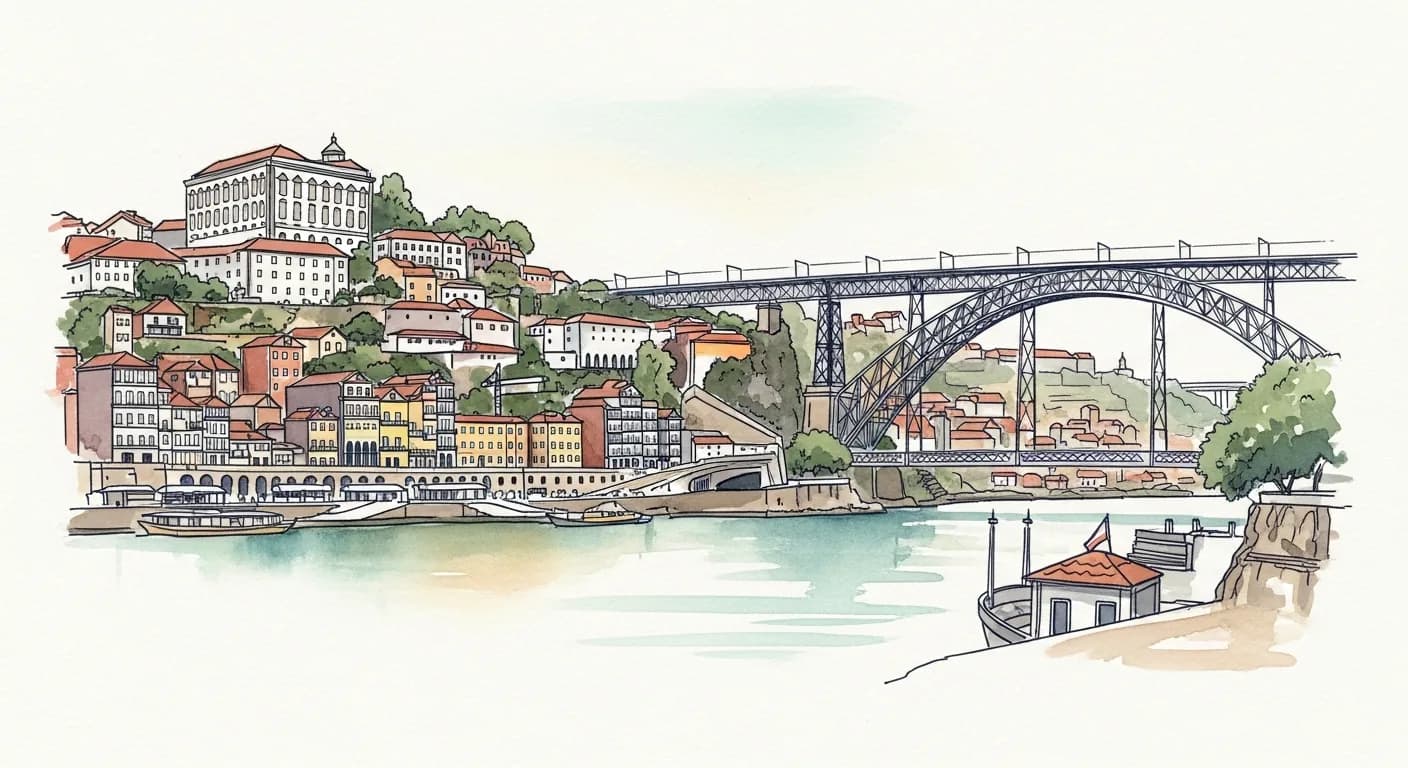
Municipality · Porto
Gondomar
Gondomar is part of the Área Metropolitana do Porto — the industrious northern capital on the Douro and its fast-growing metro ring, Portugal’s second housing market.
Last updated · First published
What does property cost in Gondomar?
These are the two municipality-level medians INE publishes for Gondomar: the transacted (sold) price and the median bank valuation, both per square metre. They are measured differently and are labelled separately, so a valuation is never presented as a sold price.
€2,227/m²
Gondomar
€2,196/m²
Gondomar
CC BY 4.0How Gondomar sold prices have moved
Median sold price · Gondomar, last 12 months (line, left axis) against dwellings sold in the last 12 months (bars, right axis).
Q4 2019 → Q1 2026Latest data: Q1 2026
Median sold price · Gondomar: Instituto Nacional de Estatística (INE), Portugal · indicator 0012234 (dim3=H1) · retrieved 2026-08-12 · CC BY 4.0
Sold in last 12 months: Instituto Nacional de Estatística (INE), Portugal · indicator 0014363 · retrieved 2026-10-02 · CC BY 4.0
Show the data as a table (26 quarters)
| Quarter | Median sold price · Gondomar (last 12 months, €/m²) | Sold in last 12 months (dwellings) |
|---|---|---|
| Q1 2026 | 2,227 | 2,274 |
| Q4 2025 | 2,138 | 2,317 |
| Q3 2025 | 2,011 | 2,264 |
| Q2 2025 | 1,902 | 2,141 |
| Q1 2025 | 1,821 | 1,976 |
| Q4 2024 | 1,746 | 1,823 |
| Q3 2024 | 1,676 | 1,704 |
| Q2 2024 | 1,621 | 1,558 |
| Q1 2024 | 1,603 | 1,529 |
| Q4 2023 | 1,570 | 1,546 |
| Q3 2023 | 1,563 | 1,617 |
| Q2 2023 | 1,551 | 1,754 |
| Q1 2023 | 1,509 | 1,890 |
| Q4 2022 | 1,479 | 2,131 |
| Q3 2022 | 1,430 | 2,302 |
| Q2 2022 | 1,385 | 2,433 |
| Q1 2022 | 1,324 | 2,483 |
| Q4 2021 | 1,274 | 2,345 |
| Q3 2021 | 1,224 | 2,294 |
| Q2 2021 | 1,184 | 2,159 |
| Q1 2021 | 1,151 | 1,997 |
| Q4 2020 | 1,136 | 2,011 |
| Q3 2020 | 1,102 | 2,006 |
| Q2 2020 | 1,062 | 2,061 |
| Q1 2020 | 1,038 | 2,137 |
| Q4 2019 | 975 | 2,209 |
Every figure in this section comes from INE and is shown with its own reference period. The sold-price and bank-valuation series are listed in the public data registry with full provenance. The dwellings-sold bars print their source, INE indicator code and licence under the chart. Sold prices and the count of dwellings sold come from INE’s house-price statistics; the bank-valuation figure is INE’s median valuation used by credit institutions.
What are the rules and costs in Gondomar?
Prices tell you what it costs to buy in Gondomar; the rules and costs below tell you what governs a purchase and what it costs to hold.
Two rules shape most purchases here — whether a property can be let short-term, and what it costs to hold each year — followed by the guides and calculator to model your full purchase.
Can you run a short-term rental here?
Short-term letting (Alojamento Local, AL) is regulated at the municipal level in Gondomar, as it is across Portugal: the national Alojamento Local regime (Decreto-Lei 128/2014, as amended) sets registration and operating requirements, while each câmara municipal can designate zonas de contenção that suspend or restrict new AL registrations. Restriction status varies by municipality and by parish, and changes over time.
This is general information, not legal advice — confirm the current status for a specific address with the Gondomar câmara municipal before assuming a property can be operated as AL.
What about annual property tax (IMI)?
Municipal Property Tax (IMI) is levied annually by the Gondomar council within a band set nationally, so the exact rate depends on the municipality and the property’s taxable value (VPT). We do not print a rate we cannot source: any specific figure we publish is drawn from the official register with its reference year, never estimated here.
To model the full acquisition cost — IMT, stamp duty and the recurring IMI — for a specific Gondomar purchase, use the cost calculator linked below.
Common questions about Gondomar
- How much does property cost per square metre in Gondomar?
- In Gondomar, the median transacted (sold) price is about €2,227 per square metre (1st Quarter 2026). The median bank valuation — what lenders appraised, a separate measure from the transacted price — is about €2,196 per square metre (August 2026). Source: Instituto Nacional de Estatística (INE), Portugal, CC BY 4.0.
- What is the reported-crime rate in Gondomar?
- In Gondomar, the reported-crime rate is about 19.2 crimes/1k residents (Registered crimes per 1,000 residents, reference period 2025 crime counts over 2021 resident population). This counts crimes recorded by the authorities, normalised per 1,000 residents so municipalities of different sizes compare fairly — it is not a measure of how likely any individual is to be affected. Derived as registered_crimes / population_2021 * 1000. Source: Instituto Nacional de Estatística (INE), Portugal, CC BY 4.0.
- How much of Gondomar is classified as urban or urbanisable land?
- In Gondomar, about 28.9% of the município's in-force planned land is classified as urban or urbanisable ("solo urbano") under its municipal master plan (PDM) (in-force municipal plans, 2015-11-09T00:00:00+00:00..2015-11-09T00:00:00+00:00); the remaining 71.1% is classified rural ("solo rústico"). This is a land-use-regime classification the município's PDM fixes — how the plan zones the territory — not a measure of how much land is physically buildable or already built, and not a price. Of about 13,186 hectares of in-force planned land — 3,813 urban/urbanisable, 8,989 rural. Source: DGT — Direção-Geral do Território, CC BY 4.0.
- How much of Gondomar's property is mapped in the national land register?
- In Gondomar, about 27.2% of the município's property tax-matrices have been georeferenced in the national land register through eBUPi (Balcão Único do Prédio) (eBUPi flow, 2021-09..2026-09). This is a data-coverage signal — how many property records have been precisely located on the map — not a measure of how much land is buildable, not a claim about who owns the land, and not a price. That is 5,612 of 20,656 registered tax-matrices. Source: eBUPi — Balcão Único do Prédio, CC BY 4.0 (eBUPi / dados.gov.pt).
- How much electricity could a solar panel generate in Gondomar?
- In Gondomar, a standard 1 kWp solar panel system mounted at its optimal tilt would generate about 1,456 kWh of electricity per year (PVGIS-SARAH2, 2005..2020), modelled by the EU Joint Research Centre's PVGIS at the município's own interior point. This is a solar-yield estimate — how much electricity the sun could produce for a standard panel — not a price, and not a claim that any particular plot may be built on. Year to year, that yield varies by about ±54 kWh (the interannual standard deviation across the modelled years). Source: JRC Photovoltaic Geographical Information System (PVGIS) v5.2, CC BY 4.0 (European Commission reuse policy; PVGIS-SARAH2).
- What healthcare access does Gondomar have?
- In Gondomar, the warehouse records medical doctors per 1,000 inhabitants: 4.9 doctors/1k inhab., reference period S7A2025; pharmacies per 1,000 inhabitants: 0.2 pharmacies/1k inhab., reference period S7A2025; hospitals: 1 hospitals, reference period S7A2024. Source: Instituto Nacional de Estatística (INE), Portugal.
- How many Blue Flag beaches does Gondomar have?
- In Gondomar, the warehouse records blue flag beaches (regional total): 58 beaches (a NUTS3 regional total shared across the surrounding region, not this municipality alone), reference period S7A2026. Source: Instituto Nacional de Estatística (INE), Portugal.
Plan your purchase
We publish a number only when the warehouse can source it. Many of the series shown here, including the sold-price and bank-valuation medians, are listed in the public data registry with their official sources, reference periods and licences. The dwellings-sold bars in the price chart print their source, INE indicator code and licence under the chart.
Buying in Gondomar?
Map the numbers on this page to your specific purchase. Speak with an advisor about costs, timeline and paperwork.
Book a free consultationMunicipalities bordering Gondomar
These municipalities share a land border with Gondomar, derived from official CAOP boundary polygons — 3 of them sit in a different district, so they do not appear in the district list below.
What is daily life like in Gondomar?
The health-access and coastal figures the warehouse can source for this município, each served verbatim with its reference period and citable source. Where a figure is published only for the surrounding NUTS region, it says so.
4.9doctors/1k inhab.
Medical doctors per 1,000 inhabitants · S7A2025
0.2pharmacies/1k inhab.
Pharmacies per 1,000 inhabitants · S7A2025
58beaches
Blue Flag beaches (regional total) · S7A2026
Regional total (NUTS3) — shared across the surrounding region, not this municipality alone. NUTS regional total broadcast to member concelhos — the WHOLE region's count, NOT this concelho's own; never sum across concelhos.
What is the weather like in Gondomar?
IPMA has published 5 distinct calendar months for Gondomar so far — these are the observed extremes over that window, not a full-year normal.
- Warmest mean daily maximum
- 28.3363°C
- Coolest mean daily minimum
- 10.5459°C
September 2026
November 2025
Observed window August 2025 – October 2026. Source: IPMA — Instituto Português do Mar e da Atmosfera (Free reuse with attribution to IPMA (open-data)).
Other municipalities in Porto
Other municipalities in the same district — each carries its own INE-sourced price, tax and safety figures.